- Font size
- A
- A


 Avansee Preload1P
 Avansee Preload1P Toric
 AvanseePreset
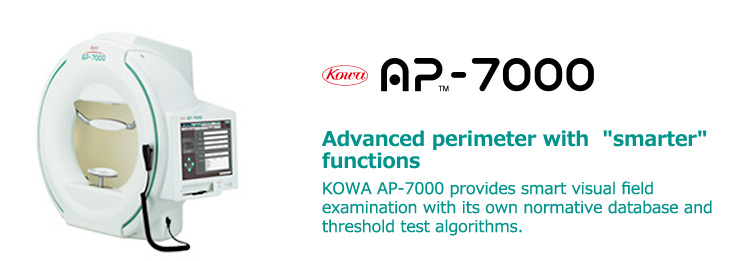
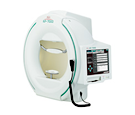 AP-7000
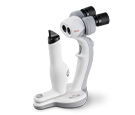 SL-19
SL-19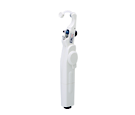 HA-2
HA-2


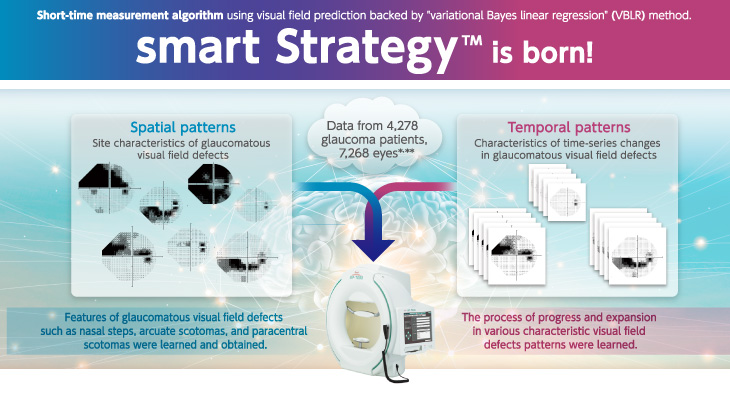

smart Strategy is a short-time measurement algorithm combined with a visual field prediction model based on VBLR. The prediction model learns spatial and temporal patterns of glaucomatous visual field defects using an enormous amount of glaucoma visual field data.
During the test, the visual field prediction model is continually updated according to the responses by the patient. By updating the intensity of stimuli and determining the sensitivity of each point, the number of stimulus presentations are then reduced to shorten test time.
Thanks to a substantial increase in accuracy of visual field prediction, test time is reduced without losing reliability.

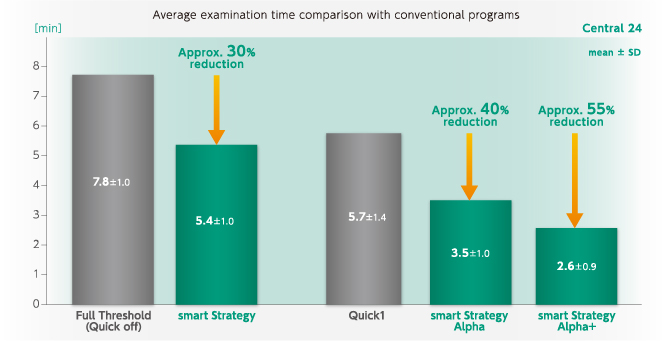
smart Strategy is a program that offers shorter examination time without losing reliability by combining the above method with conventional Full-Threshold testing.
smart Strategy Alpha allows shorter examination time by the combination of a highly accurate visual field prediction and Kowa's conventional short-time algorithm (Quick 1).
smart Strategy Alpha+ is the fastest threshold test algorithm in KOWA AP-7000, suggested to be used for screening. It is based on Quick 1 as well as smart Strategy Alpha, but provides even shorter examination time by using further enhanced prediction methods.
Internal material: AP-7000 joint research with The University of Tokyo material No.2
Simulation based on data from 547 glaucoma patients, 911 eyes
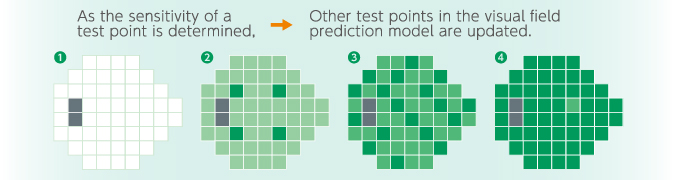
The test is administered in the following order.
1Prior to the test, there is no visual field information except for the patient's age.
2The threshold values of the primary points (first 4 points) are tested, and the other test points in the visual field prediction model are updated from the results.
34As the threshold value of each test point is determined, the visual field prediction model in the other test points are updated.
The intensity of stimuli is updated, and the threshold is determined.
In addition to central 30°, which is used to observe the progression of glaucoma, a wide variety of tests are available including central 10°, which is useful to identify visual field abnormalities in the macula.
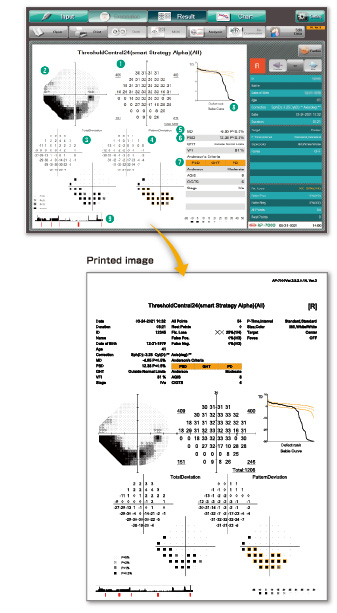
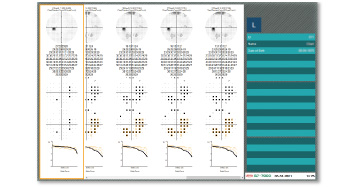
■Clear Display of Analysis Results
1Threshold (Measured Values)
■Analysis Indices
■Time-series Display
A series of examination results such as examination information, scales, thresholds, total deviations (p-values), pattern deviations (p-values) and Bebie curves are displayed in chronological order. Each column lists the results of a single examination.
Base data can be set allowing the operator to easily observe the changes over time.
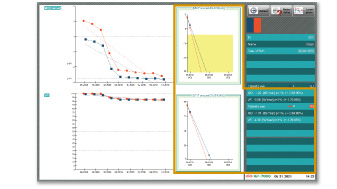
■Chronological Change Display
Test result analytical indices such as MD, PSD, VFI, box plot, etc. can be graphically displayed as time series data to give a clear understanding of changes over time in the tested eyes.
Furthermore, for MD and VFI, prediction graphs calculated from the linear rate of change of the analytical indices are displayed.
■Major threshold test programs
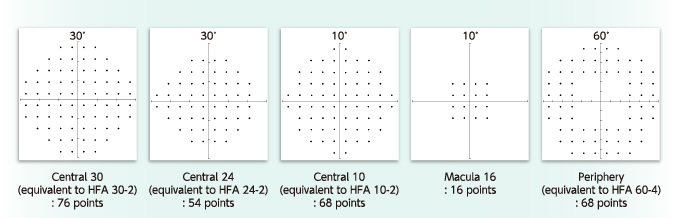
smart Strategy supports Central 30 (30-2), Central 24 (24-2),and Central 10 (10-2) in the threshold test programs.
■Kinetic visual field examination
Supports automatic mode, manual mode, and automatic + manual mode. Can enlarge an image of a 30°range around the center.
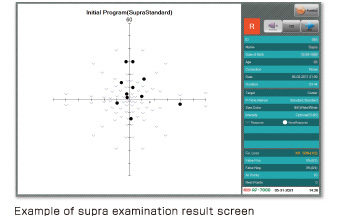
■Simultaneous evaluation of the peripheral and central visual fields
Equipped with a program that combines Isopter with other static visual field examinations including threshold, allowing simultaneous examination of both the peripheral and central visual fields.
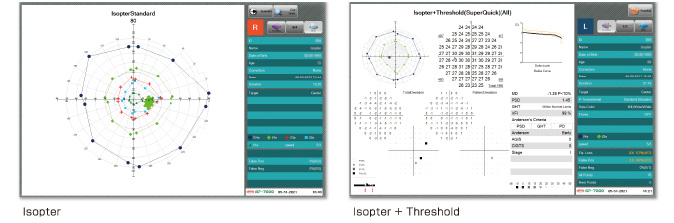
Enables simple examination with a single intensity level.
■Esterman Both
The Esterman Both is an examination to carry out on both eyes (binocularly), which is applicable for patients who normally wear glasses when driving.
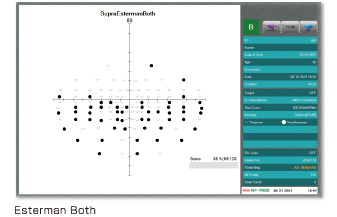
4-zone measurement that goes beyond screening, and programs using probability values (p-values) in intensity steps, are among the features that enable an effective test in less time.
■English
■Chinese
■French
■German
■Italian
■Portuguese
■Russian
■Spanish
■Korean
■Japanese
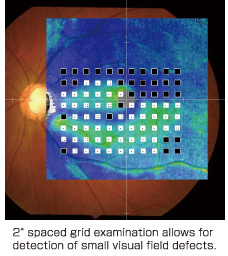
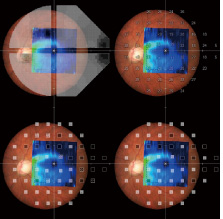
■Fundus Oriented Perimetry
Fundus images or OCT images can be imported into the KOWA AP-7000, and selected regions of the fundus can be examined. This examination is particularly designed with a 2° spaced grid which gives more precise information than a general threshold examination with a 6° spaced grid.
Comparing the structure and function of the fundus may help detect glaucoma at an early stage.
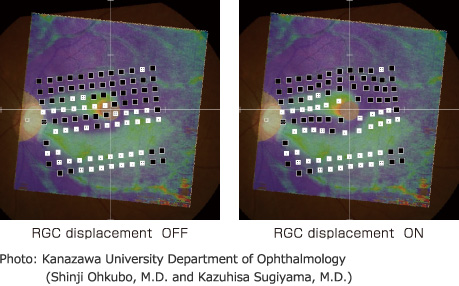
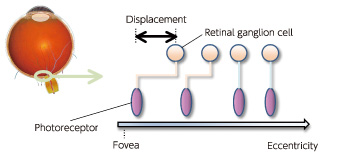
■RGC displacement
To evaluate the structure and function of the macular area, it is important to consider the difference in displacement between the photoreceptor cells and retinal ganglion cells.
It is said that the photoreceptor cells and retinal ganglion cells are displaced in the macular area. The results of a fundus-oriented visual field examination can be displayed alone or overlaid on a fundus image to reflect this difference.
Reference
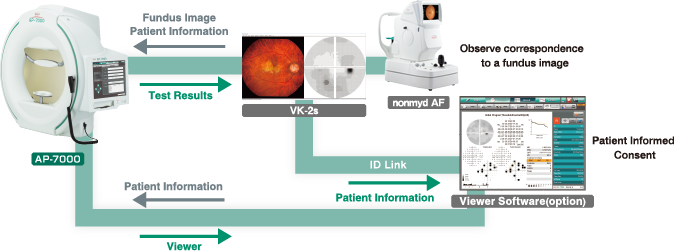
■Integration of Structure and Function Provides Increased Interpretation of Visual Field Results
Decibels, deviation maps,and probability plots can be integrated with your patients fundus images.
Distribution name:KOWA AP-7000
Preloaded Intraocular Lens (1P)
Preloaded Intraocular Lens
(1P Toric)
Preloaded Intraocular Lens (3P)


 FM-600
 FM-700